Leading vs Lagging Indicators and How They Reveal Business Trends
By Chelvis “CJ” Marshall, President & Founder
Learn how leading indicators vs lagging indicators in business reveal trends, connect activity to outcomes, and help leaders make timely management decisions.

Article by
Chelvis “CJ” Marshall
Chelvis "CJ" Marshall is President and Founder of Marshall Solutions Group (MSG), a veteran-owned management consulting firm helping organizations strengthen leadership, improve operations, and turn strategy into disciplined execution. MSG specializes in Organizational & Operational Improvement, Growth Strategy & Business Development, and Program & Project Management.
A retired U.S. Navy Senior Chief, CJ served as the senior enlisted engineering leader aboard USS McCampbell (DDG-85), overseeing a 137-person engineering department responsible for mission-critical shipboard systems. He subsequently advanced into Fortune 500 enterprise sales and leadership, bringing operational discipline and commercial experience to complex business environments. He is completing his MBA at Syracuse University's Whitman School of Management.
CJ's approach reflects a central principle: strategy creates direction, but leadership, accountability, and disciplined execution determine whether organizations can deliver. His work focuses on helping leadership teams establish the structures, operating practices, and management discipline needed for sustained performance.
A business can meet its revenue target and still be heading into trouble. The difference between leading indicators vs lagging indicators in business helps explain why: leading measures track activities or conditions that may signal what comes next, while lagging measures show results that have already occurred. Neither tells the whole story on its own.
Lagging measures such as revenue confirm performance; leading measures such as qualified opportunities can give leaders an earlier signal to investigate. But an early signal is useful only when it connects to an outcome that matters. This article explains how the two types differ, how to pair them, and how to use leading indicators to spot possible business trends before they appear in results. The goal is practical: build a clearer view of performance and decide where management attention may be needed.
Key Takeaways
- Use early signals to spot possible changes before they appear in business results, and treat them as prompts to investigate rather than guarantees.
- Pair activity measures with outcome measures so you can see both what teams are doing and whether it is producing the intended result.
- Choose indicators that connect clearly to a business goal, then review them consistently to identify trends and gaps between activity and outcomes.
- Keep measurement focused and assign ownership so leaders can turn useful signals into timely decisions and follow-through.
Table of Contents
Leading vs Lagging Indicators: What's The Difference?
Leading indicators track activities or conditions that may precede outcomes; lagging measures record results already achieved.
Leading Signals Across Business Functions
Leading indicators measure factors that may influence later outcomes. In customer support, response time and first-call resolution track service factors connected to customer satisfaction. Sales calls, emails, meetings, and opportunities created may precede revenue. Training completion measures effort, but later performance data must show whether learning improved results.
Lagging Outcomes Across Business and IT
Lagging indicators record results after the activity, giving leaders evidence of performance. Business examples include revenue, corporate profits, and labor cost per unit. IT reports can track completed outages or incident-resolution time. Subscription businesses may monitor MRR, customer retention, CAC, and cash runway. Early renewals, add-on purchases, seat expansions, and product activation can signal future subscription outcomes.
Measuring and Validating Leading Indicators
Measure each leading metric consistently, define its data source and owner, and connect it to a specific goal. Compare changes in support response, sales activity, or activation with later customer satisfaction, revenue, or retention. This helps validate whether a signal is useful. Correlation alone does not establish cause, so account for other changes and drop measures that do not guide decisions.
Balancing Indicators in KPI Dashboards
Pair actionable leading measures with related lagging outcomes on the same dashboard. Review early signals daily or weekly, then assess financial results monthly or quarterly. Common mistakes include treating activity as value, assuming one signal predicts outcomes, and tracking metrics without clear ownership. When early activity and later results diverge, investigate the gap before changing targets or incentives.
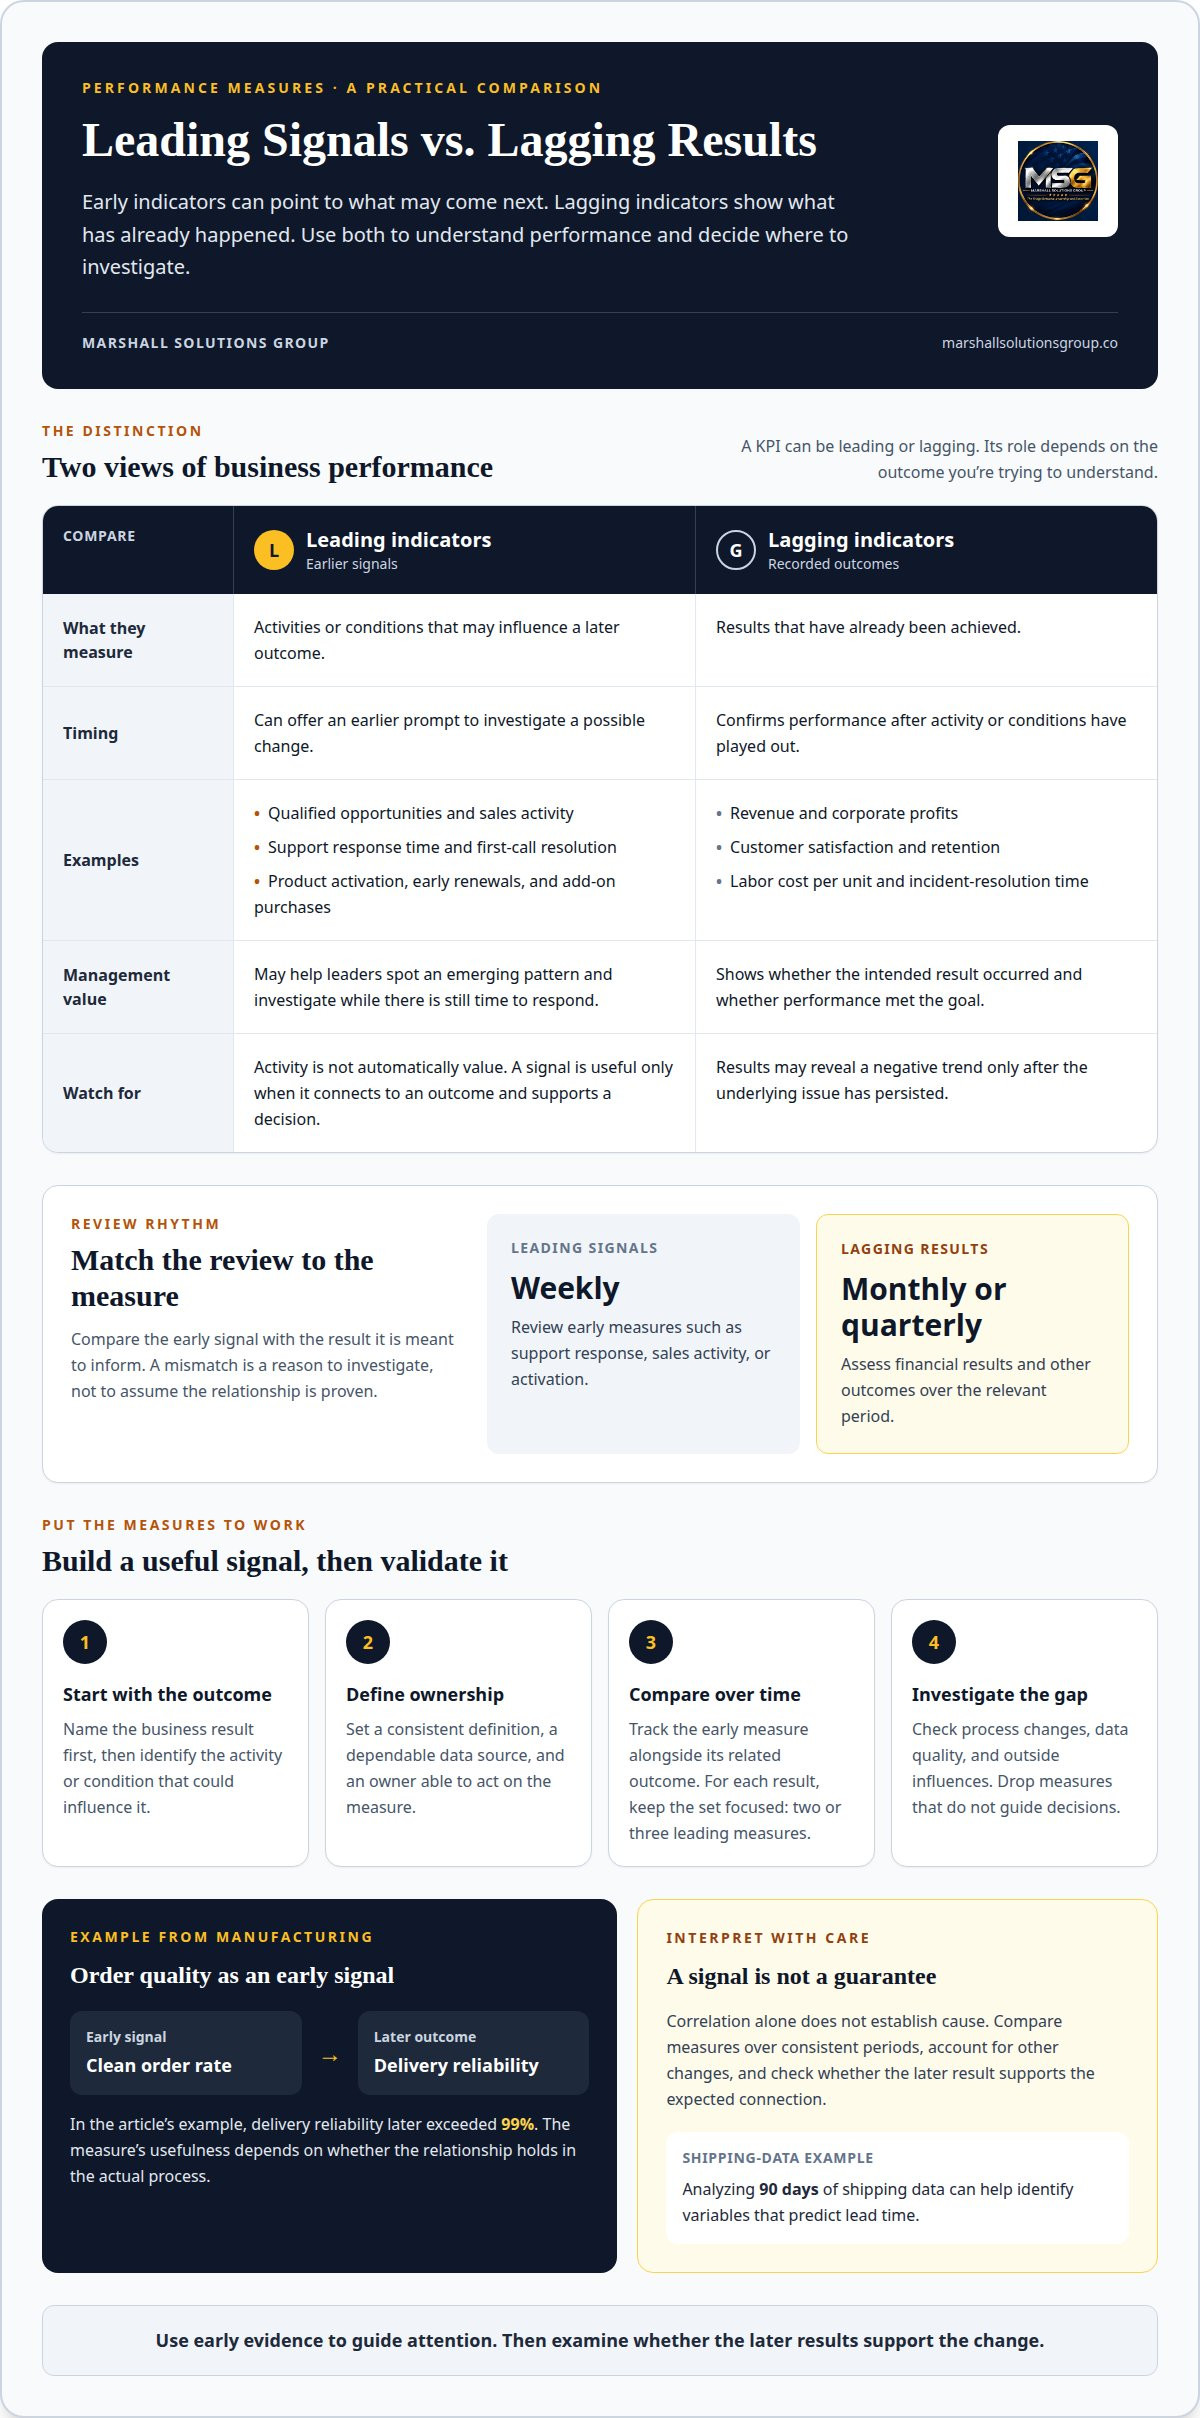
Differences between leading and lagging indicators
Understanding leading indicators vs lagging indicators in business starts with the outcome being measured. A leading measure tracks a condition that may signal a later result; a lagging measure records a result already achieved. Employee engagement, for example, may indicate future discretionary effort, while that same score can reflect the past usefulness of one-on-ones. A measure’s role depends on the goal.
A KPI is a measure tied to a strategic objective, and it can be leading or lagging. A sales-team skills index can show the result of training while also signaling potential for future sales. Leaders should ask what decision a metric supports, what outcome it may predict, and whether the team can influence it. This keeps the label connected to management action rather than treating every KPI as a forecast.
The difference between leading indicators vs lagging indicators in business also depends on timing. Historical measures show whether a strategy produced its intended outcome; predictive measures offer an earlier signal, not certainty. Compare a leading measure with its related outcome over consistent periods, then investigate mismatches. A measure may be lagging for one goal but leading for another connected goal. Treating labels as permanent, or assuming correlation proves cause, can lead to poor decisions. Use early evidence to guide adjustments, then examine whether later results support the change.
Lagging KPIs cannot be acted on directly and may reveal a negative trend only after the underlying problem has persisted for a long time.
Using leading indicators to anticipate business trends
To use leading indicators vs lagging indicators in business effectively, start with the outcome and trace the activity that could influence it. For a quarterly MRR goal, examine earlier signals such as activation or feature engagement, then compare them with monthly results. A useful indicator connects operational behavior to a later effect. Activity without that connection creates dashboard noise, not insight.
Select measures with a clear relationship to the outcome and an owner able to act. In a manufacturing example, clean order rate served as an early signal for delivery reliability, which later exceeded 99 percent. Analyzing 90 days of shipping data can also help identify variables that predict lead time. The right measure depends on the actual process.
Review leading indicators vs lagging indicators in business at different intervals. Monitor early measures weekly, then review lagging results monthly or quarterly. Compare the expected sequence with what actually happened. If stronger order quality does not precede more reliable deliveries, examine process changes, data quality, and outside influences before changing targets.
A monthly review should produce a decision, not just a report. Compare key performance measures over time, identify where signals and outcomes diverge, and assign an owner to investigate. A focused set of two or three leading measures for each lagging result can help leaders identify which activities deserve attention without crowding the dashboard.
How Marshall Solutions Group Can Help
We help leaders connect operational measures to decisions and execution. If teams track activity but cannot explain how it relates to results, we can review the measures, reporting routines, and accountability behind performance as part of organizational and operational improvement work. The focus is practical: clarify what each metric represents, who owns it, and which decisions it should inform.
For example, a business monitoring customer response time needs a consistent definition, a dependable data source, and an outcome to compare it with, such as customer satisfaction. A baseline provides a reference point; regular review can show whether performance is shifting. The analysis should also identify where teams can influence the measure and where other factors may affect results. Without clear ownership, even a well-chosen metric can sit untouched on a dashboard.
We can help connect performance measures with priorities and management routines. Where implementation support fits the agreed scope, we can also help put revised reporting or operating practices into use. The right support depends on the issue: unclear measures may call for a review, while a defined execution gap may require focused consulting and follow-through.
If your measures aren’t helping leaders make decisions, explore organizational and operational improvement services with Marshall Solutions Group.
Frequently Asked Questions
Which type of indicator should you use to understand operational performance?
Use measures that show both whether work is completed reliably and whether the process achieves its intended result. For a hypothetical operations improvement, monitor rework alongside completion of the required work. Break results out by team or process stage; an overall average can conceal a problem affecting one group. Pair those findings with employee feedback to guide investigation.
Are Leading Metrics Contributing to the Lagging Ones?
Leading measures may contribute to later results when they represent a mechanism that can affect them. Test that mechanism by documenting the change made, the teams or processes exposed to it, and the expected outcome. A small pilot or comparison between similar groups can provide stronger evidence than a dashboard trend alone. If the early measure moves but the result does not, another constraint may be limiting the impact.
Isn’t “Training Hours” in the Previous Example a Lagging Indicator?
It depends on the goal. If the goal is delivering a training plan, recorded hours show what has already been completed. If the goal is better work performance, those hours are an input, not proof of capability. A practical follow-up is to observe whether employees can perform the trained task to the required standard during routine work.
What are indicators?
Indicators are selected measures used to assess a condition that matters to a decision. Raw figures become useful indicators when leaders define what they represent and how the information will guide action. For example, a hypothetical team could monitor the age of unresolved work requests to decide whether to reassign capacity or address a recurring process bottleneck.
What is the Difference Between Critical Success Factors and Leading Metrics?
A critical success factor describes a condition that must be in place for an objective to succeed. A leading metric quantifies evidence of that condition. For a project requiring fast blocker resolution, clear escalation ownership could be a success factor; tracking unresolved blockers by assigned owner could indicate whether that condition is in place. The metric should inform action, not replace judgment.
Disclaimer
The information provided in this article is for general informational and educational purposes only and does not constitute legal, financial, accounting, engineering, or other professional advice. Marshall Solutions Group, Inc. makes no representations or warranties regarding the completeness or applicability of this information to any specific situation. Readers should consult appropriately qualified professionals before making decisions requiring specialized professional advice.