Value Stream Mapping for Business Process Flow and Symbols
By Chelvis “CJ” Marshall, President & Founder
See how value stream mapping for business processes connects work, information, handoffs, and delays, and how key symbols reveal waste across the full flow.

Article by
Chelvis “CJ” Marshall
Chelvis "CJ" Marshall is President and Founder of Marshall Solutions Group (MSG), a veteran-owned management consulting firm helping organizations strengthen leadership, improve operations, and turn strategy into disciplined execution. MSG specializes in Organizational & Operational Improvement, Growth Strategy & Business Development, and Program & Project Management.
A retired U.S. Navy Senior Chief, CJ served as the senior enlisted engineering leader aboard USS McCampbell (DDG-85), overseeing a 137-person engineering department responsible for mission-critical shipboard systems. He subsequently advanced into Fortune 500 enterprise sales and leadership, bringing operational discipline and commercial experience to complex business environments. He is completing his MBA at Syracuse University's Whitman School of Management.
CJ's approach reflects a central principle: strategy creates direction, but leadership, accountability, and disciplined execution determine whether organizations can deliver. His work focuses on helping leadership teams establish the structures, operating practices, and management discipline needed for sustained performance.
A process map can show every step and still miss why work stalls. Value stream mapping for business processes makes the full flow visible, connecting the work itself with the information, handoffs, waiting, and inventory that shape how a product or service reaches the customer. It starts with the current state and provides a basis for designing a future state. The goal isn’t a more complicated diagram; it’s a clearer view of where value is created and where time is consumed.
A process map documents what happens within a workflow. But when local fixes do not resolve delays or coordination problems across teams, leaders may need a broader view. This article explains what value stream mapping is, how to read its common symbols, and how it differs from process mapping. You’ll learn what process boxes, inventory markers, flow lines, and data boxes show, and which method can help you understand the work before deciding what to change.
Key Takeaways
- Use a value stream map to see how work, information, and delays connect across the full path to the customer.
- Read process boxes, inventory markers, flow lines, and data boxes as parts of one operational picture.
- Choose process mapping to clarify steps within a workflow; use value stream mapping when the broader flow and waste between processes matter.
- When recurring bottlenecks cross teams or responsibilities, operational improvement support can help turn the map’s findings into practical changes.
Table of Contents
What Is Value Stream Mapping?
Value stream mapping for business processes tracks how work moves from request to delivery, including the decisions and handoffs that shape the customer experience. Teams use observed evidence to compare current performance with a practical target state.
Purpose and Benefits
A value stream map helps leaders see whether delays stem from a single task or dependencies across functions. This distinction matters: optimizing one team can simply move a queue without improving service. A process map clarifies task ownership, while a value stream view helps leadership prioritize changes based on the customer outcome.
Creating a Value Stream Map
Start by selecting a service family, observing the work, and recording information flow, process data, and waiting points. Validate the current-state map with the team, define a future state, then assign actions and owners. Common risks include mapping assumptions instead of actual work, missing informal approvals, and proposing changes without considering capacity. Evaluate value stream mapping for business processes against baseline and follow-up measures such as lead time, rework, and service quality. ROI analysis compares quantified benefits with implementation effort.
Mapping Office and Service Processes
In administrative settings, the unit being mapped might be a customer request, invoice, or internal approval. Follow records through intake, review, decision, and handoff, noting queues and repeated corrections. This can reveal work hidden in inboxes or informal escalation paths. Managers can then decide whether to simplify a rule, clarify authority, or coordinate functions differently.
A value stream includes the value-creating and non-value-creating actions involved in bringing a product from raw material to the customer. Mapping these actions helps teams identify waste and opportunities to improve efficiency.
Value Stream Mapping Symbols
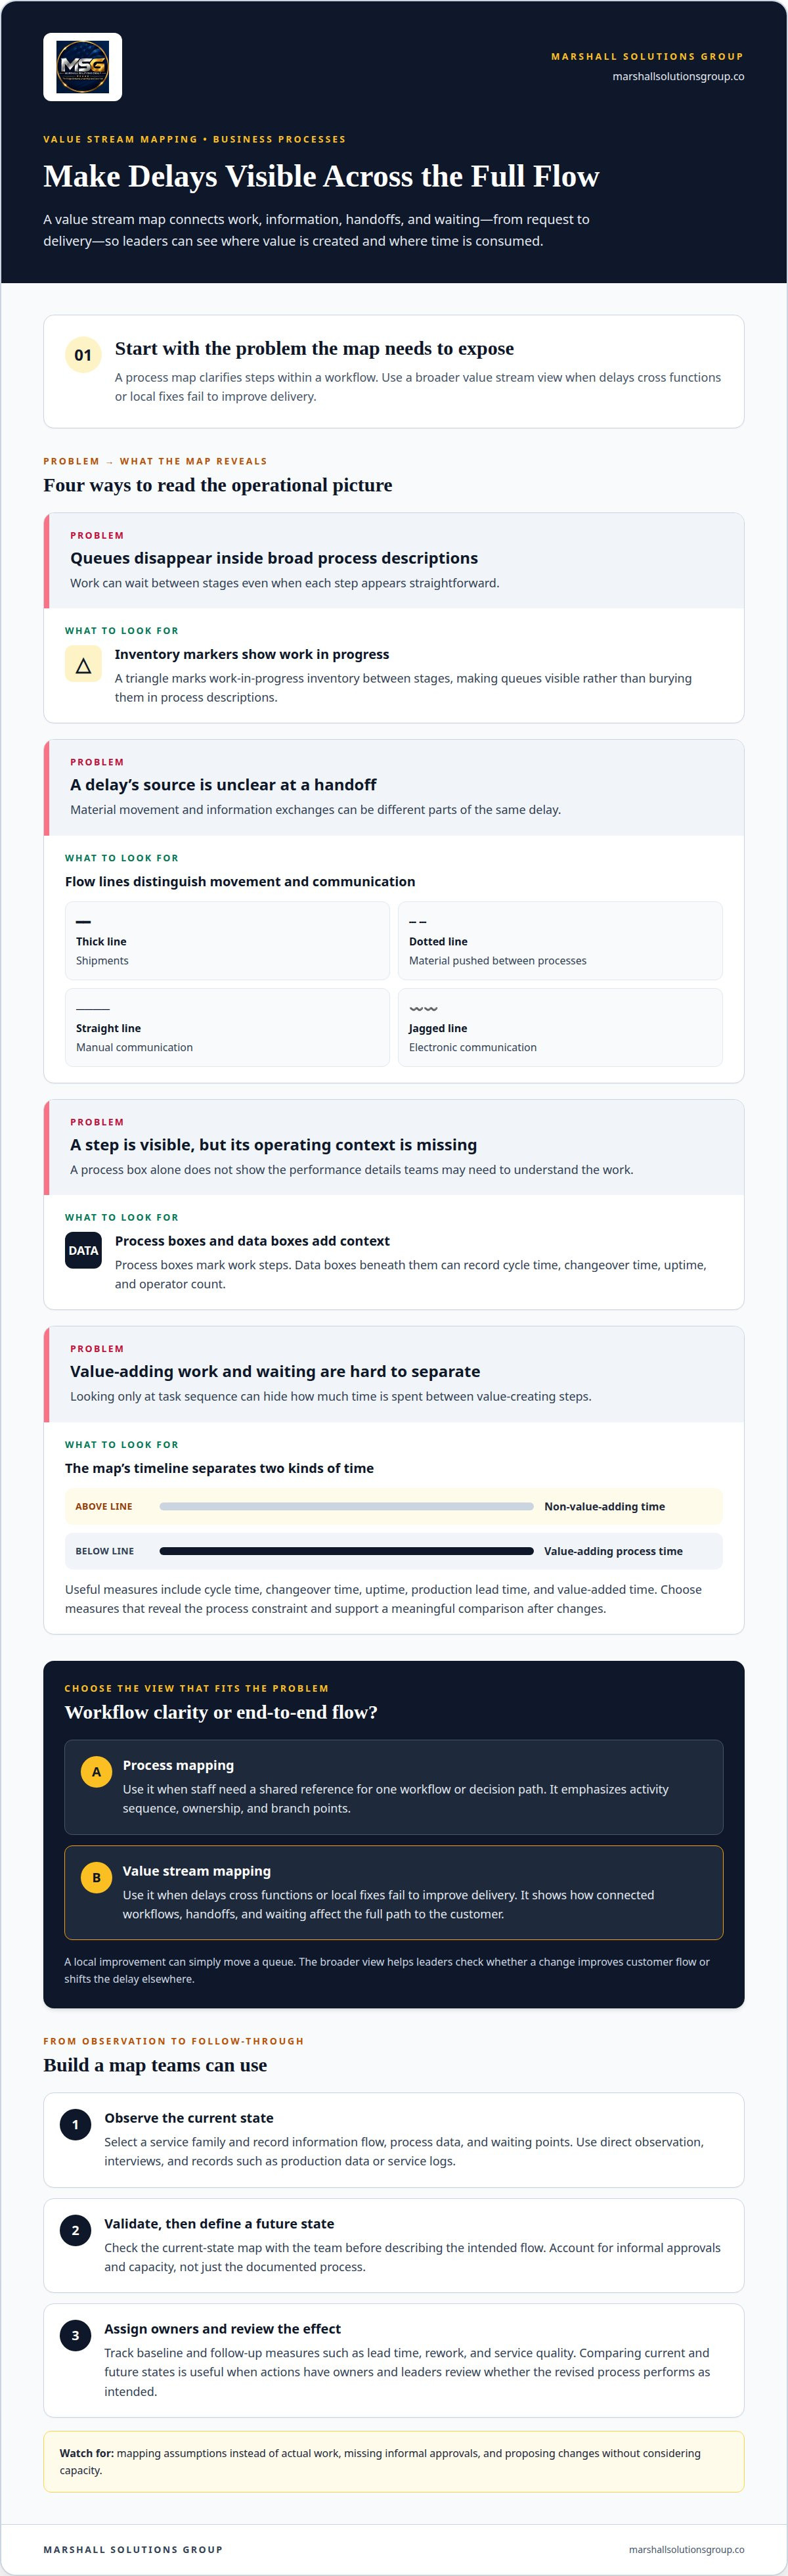
A value stream map uses a consistent format to show processes, inventory, and information flow. In manufacturing, process boxes mark work steps, while data boxes beneath them can record cycle time, changeover time, uptime, and operator count. A triangle marks work-in-progress inventory between stages, making queues visible rather than burying them in broad process descriptions.
Lines show how materials and instructions move. Thick lines represent shipments, while dotted lines show material pushed between processes. Straight lines indicate manual communication, and jagged lines indicate electronic communication. These distinctions help teams identify whether a delay stems from physical movement, a push system, or an information handoff.
Useful measures include cycle time, changeover time, uptime, production lead time, and value-added time. On the map’s timeline, value-adding process time appears below and non-value-adding time above. Choose measures that reveal the process constraint and support a meaningful comparison after changes.
Build maps using direct observation, interviews, and records such as production data or service logs. A team might draft the diagram on a whiteboard with sticky notes, then refine it in spreadsheet or diagramming software. The tool matters less than consistently recording actual work during current-state analysis and future-state development.
Typical process-mapping flowcharts use ovals for starts or ends, rectangles for activities, diamonds for decisions, and parallelograms for inputs or outputs. Unlike value stream symbols, these shapes clarify sequence and decision logic, not inventory or continuous material flow.
Differences Between Value Stream Mapping and Process Mapping
Process mapping follows activities and decisions within a defined workflow. Its visual format emphasizes sequence, ownership, and branch points. Value stream mapping for business processes looks across connected workflows to show how delays and handoffs affect end-to-end delivery. This broader view helps leaders determine whether a local improvement changes customer flow or merely shifts a queue elsewhere.
A current-state value stream map records observed conditions, including work movement and delays. A future-state map describes the intended flow after proposed changes. Comparing the two makes the gap visible, but that comparison is useful only when leaders assign owners and track whether the revised process performs as intended.
Consider a hypothetical healthcare referral process. A process map can clarify review steps, scheduling decisions, and patient notification. A broader value stream view can reveal referrals waiting between departments, even when each team follows its own procedure. This helps the organization address coordination across the full service instead of revising one team’s instructions in isolation.
When considering value stream mapping for business processes, start with the scope of the problem. Use process mapping when staff need a shared reference for one workflow or decision path. Choose a value stream view when delays cross functions or local fixes fail to improve delivery. Both formats can support continuous improvement when teams use the findings to guide decisions and review the effects of changes.
Organizational and Operational Improvement at Marshall Solutions Group
Marshall Solutions Group helps leadership teams connect operational findings to decisions through its Organizational & Operational Improvement services. This support can fit when leaders see recurring execution problems but lack agreement on root causes, priorities, or ownership. An assessment can examine how responsibilities, management routines, and workflows interact, giving leaders a basis for deciding which issue deserves focused attention.
Support is useful when a map’s findings cross team boundaries, improvement work stalls after recommendations, or leaders need to align changes with operating priorities. We help clarify decision rights, sequence the work, and define how progress will be reviewed within the agreed scope. This keeps attention on changes the organization can own, rather than on a diagram disconnected from daily management.
Marshall Solutions Group’s Organizational & Operational Improvement services may also fit when process changes affect growth plans, leadership expectations, or coordination across business units. Leaders bring the operational question and decisions under consideration; the engagement scope defines responsibilities and deliverables. This is a practical next step when teams need help translating analysis into coordinated work. Organizations that can assign ownership and carry changes forward internally may not need this support.
Contact Marshall Solutions Group to discuss an operational assessment.
Frequently Asked Questions
What is value stream mapping in business processes?
Use value stream mapping when leaders need to frame an improvement effort around a customer-facing outcome rather than one department’s tasks. For example, a business might map order fulfillment, then clarify which functions contribute. Defining that boundary keeps the analysis focused and makes cross-functional responsibilities easier to discuss.
What are the main symbols used in a value stream map?
Agree on a legend before reviewing a map, especially when participants come from different functions. Each symbol should mean the same thing throughout the diagram, and labels should distinguish actual observations from proposed changes. This prevents visual shorthand from being mistaken for a confirmed process fact or an approved decision.
How does a professional identify process waste and bottlenecks with value stream mapping?
Test whether a suspected constraint occurs repeatedly or reflects an unusual case. Compare observed work with available process records, and ask people in affected roles to explain exceptions. This helps distinguish a persistent operating issue from an isolated disruption, so leaders can prioritize changes based on their effects on service and workload.
What software and templates do professionals use for value stream mapping?
Choose a format that the people responsible for reviewing and maintaining the map can edit. A useful working file should include a clear legend, identify the process scope, define each measure, and distinguish proposed changes from observed conditions. Version control matters too: teams need to know which map reflects the current agreed view.
How does value stream mapping compare with process mapping and Lean Six Sigma?
Lean Six Sigma is a broader improvement methodology; value stream mapping is a recognized method used within it. The map can help frame where analysis should focus, but it isn’t a substitute for selecting a problem, evaluating evidence, and managing change. Treating the diagram as the entire improvement effort risks leaving decisions and follow-through unresolved.
Disclaimer
The information provided in this article is for general informational and educational purposes only and does not constitute legal, financial, accounting, engineering, or other professional advice. Marshall Solutions Group, Inc. makes no representations or warranties regarding the completeness or applicability of this information to any specific situation. Readers should consult appropriately qualified professionals before making decisions requiring specialized professional advice.